Tutorial
This tutorial will show you how to use MPB to generate .h5 files, convert them to .vts and then view them using paraview.
Instructions for installing MPB can be found here: https://mpb.readthedocs.io/en/latest/Installation/
Paraview can be downloaded and installed from here: https://www.paraview.org/
If you want to do a quick test without installing MPB, skip ahead to here.
Define the geometry
Create (or download) lattice-non-cartesian.ctl with the following contents:
(set! resolution 50)

(define a1 (vector3* 0.5 (vector3 0 2 3)))
(define a2 (vector3* 0.5 (vector3 1 0 3)))
(define a3 (vector3* 0.5 (vector3 1 2 0)))

(define L1 (vector3-norm a1))
(define L2 (vector3-norm a2))
(define L3 (vector3-norm a3))

(set! geometry-lattice
  (make lattice
    (basis1 a1)
    (basis2 a2)
    (basis3 a3)
    (basis-size L1 L2 L3)
  )
)

(set! geometry (list
  (make cylinder
    (axis 1 0 0)
    (center 0 -0.5 -0.5)
    (height L1)
    (radius 0.25)
    (material (make dielectric (epsilon 2)) )
  )
  (make cylinder
    (axis 0 1 0)
    (center -0.5 0 -0.5)
    (height L2)
    (radius 0.25)
    (material (make dielectric (epsilon 3)) )
  )
  (make cylinder
    (axis 0 0 1)
    (center -0.5 -0.5 0)
    (height L3)
    (radius 0.25)
    (material (make dielectric (epsilon 4)) )
  )
))

(run)
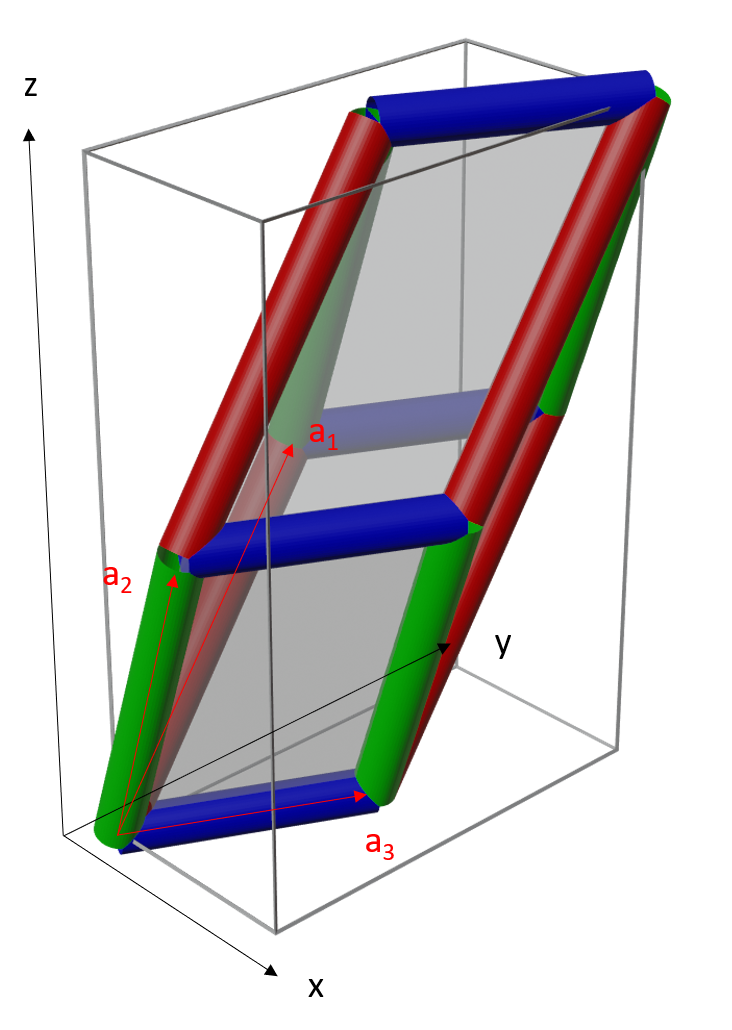
The first part defines a lattice with the following basis vectors:
\(\vec{a_1} = \frac{1}{2}[0,2,3]\)
\(\vec{a_2} = \frac{1}{2}[1,0,3]\)
\(\vec{a_3} = \frac{1}{2}[1,2,0]\)
The second part defines a geometry made of cylinders along the edges of the unit-cell. Since MPB simulates periodic structures, only 3 cylinders are needed to visualize all 12 edges of the unit-cell.
The cylinders all have different permittivity values in order to distinguish them more easily later on.
The expected geometry should look as in this picture:
Generate the HDF5 files by running MPB
mpb ./lattice-non-cartesian.ctl
This should generate a ./lattice-non-cartesian-epsilon.h5 file:
ls ./lattice-non-cartesian-epsilon.h5
Note
If you do not have MPB available, you can simply download the corresponding .h5 file here: h5utils/data/lattice-non-cartesian-epsilon.h5.
Convert the HDF5 file to a VTS file
h5tovts ./lattice-non-cartesian-epsilon.h5
This should generate a ./lattice-non-cartesian-epsilon.vts file:
ls ./lattice-non-cartesian-epsilon.vts
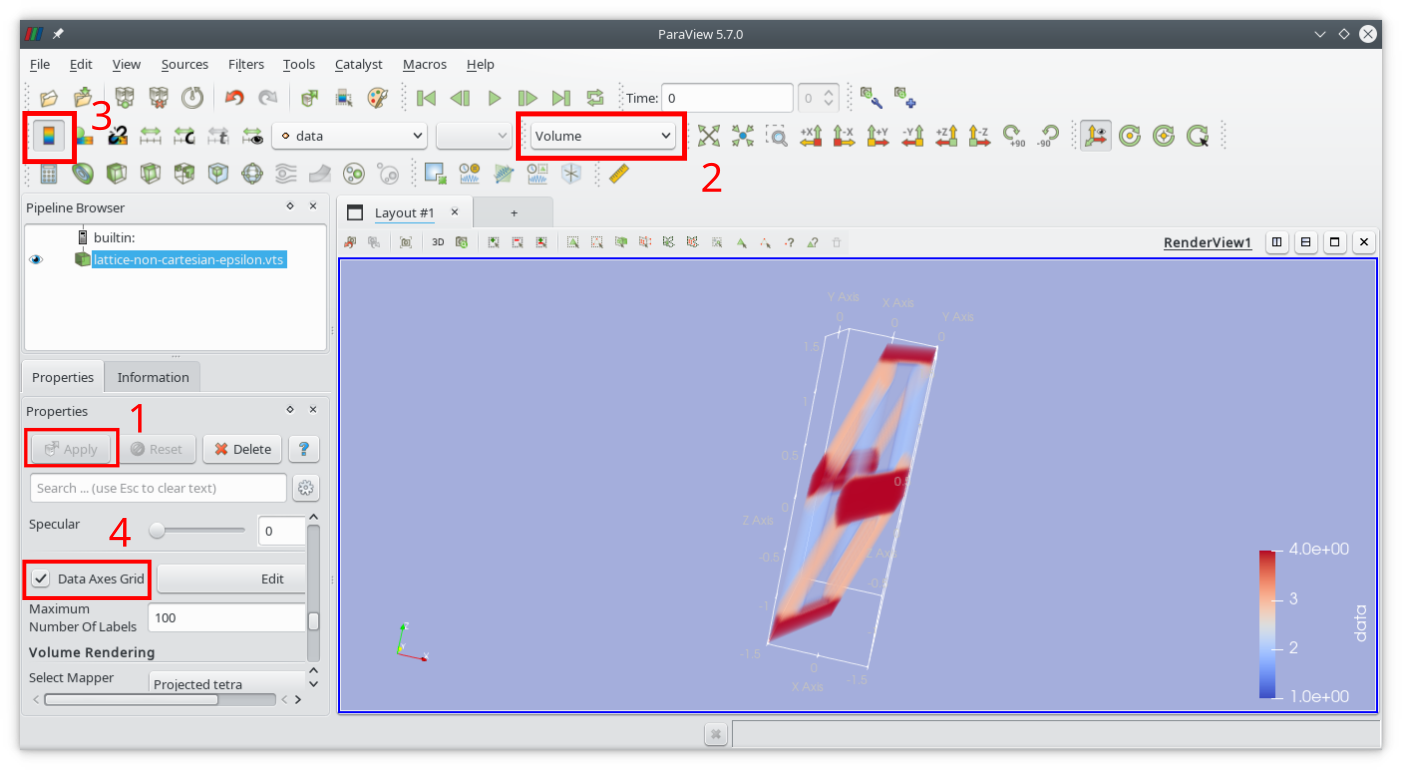
View the VTS file in Paraview
Open the VTS file in Paraview and then:
Click apply.
Select “Volume” rendering.
Activate the colorbar.
Enable Axes Grid
See picture below for reference:
Alternatively, you could add threshold filters for permittivity ranges corresponding to the values used (2, 3 and 4) and choose red, green and blue colors to render the geometry like this:
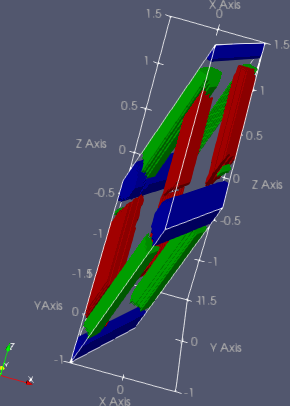
You can try out those settings more easily using this saved state file: h5utils/data/lattice-visualization-non-cartesian.pvsm.